Qué es una superelipse
Una superelipse, también conocida como curva de Lamé en honor a Gabriel Lamé, es una curva cerrada que se asemeja a la elipse, conservando las características geométricas del semieje mayor y el semieje menor, y la simetría sobre ellos, pero con una forma general diferente .
En el sistema de coordenadas cartesianas, el conjunto de todos los puntos (x, y) de la curva satisfacen la ecuación
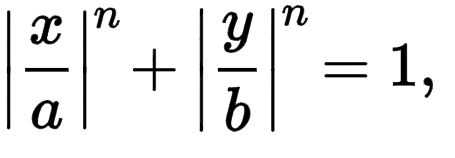
where n, a and b are positive numbers, and the vertical bars | | around a number indicate the absolute value of the number.
a = 1 y b = 0,75
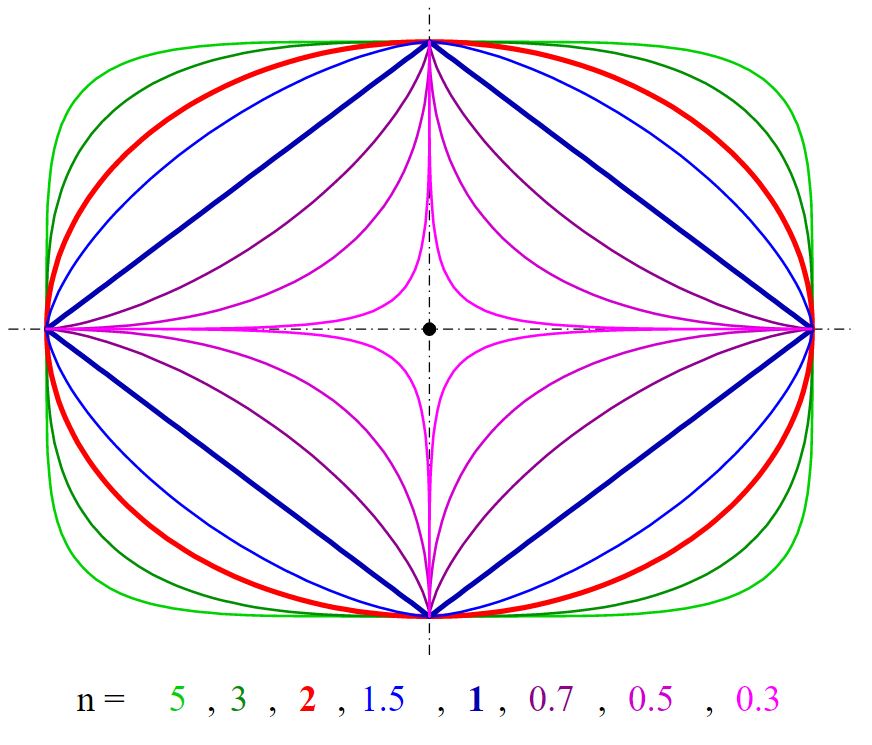
Hay muchos casos específicos de superelipse como se muestra en la imagen de abajo: 
Estos se pueden lograr variando el valor de n en la ecuación. Así que ahora tratamos de implementar esto en python y para hacerlo necesitamos algunas bibliotecas.
Módulos Requeridos:
- matplotlib : para trazar la curva de la ecuación. Es una biblioteca de terceros en python y si desea instalarla, haga clic aquí .
- matemáticas : es una biblioteca integrada de python que tiene casi todas las herramientas matemáticas.
# Python program to implement
# Superellipse

# importing the required libraries
import matplotlib.pyplot as plt
from math import sin, cos, pi

def sgn(x):
    return ((x>0)-(x<0))*1

# parameter for marking the shape
a, b, n = 200, 200, 2.5
na = 2 / n
# defining the accuracy
step = 100
piece =(pi * 2)/step
xp =[];yp =[]

t = 0
for t1 in range(step + 1):
    # because sin ^ n(x) is mathematically the same as (sin(x))^n...
    x =(abs((cos(t)))**na)*a * sgn(cos(t))
    y =(abs((sin(t)))**na)*b * sgn(sin(t))
    xp.append(x);yp.append(y)
    t+= piece

plt.plot(xp, yp) # plotting all point from array xp, yp
plt.title("Superellipse with parameter "+str(n))
plt.show()
Producción:
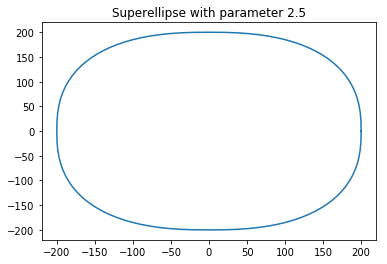
cuando n = 2.5
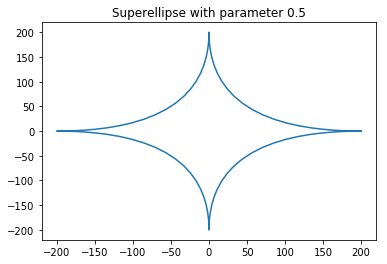
Ahora veamos qué sucede cuando cambiamos el valor de n a 0.5
# Python program to implement
# Superellipse
# importing the required libraries
import matplotlib.pyplot as plt
from math import sin, cos, pi

def sgn(x):
    return ((x>0)-(x<0))*1

# parameter for marking the shape
a, b, n = 200, 200, 0.5
na = 2 / n
# defining the accuracy
step = 100
piece =(pi * 2)/step
xp =[];yp =[]

t = 0
for t1 in range(step + 1):
    # because sin ^ n(x) is mathematically the same as (sin(x))^n...
    x =(abs((cos(t)))**na)*a * sgn(cos(t))
    y =(abs((sin(t)))**na)*b * sgn(sin(t))
    xp.append(x);yp.append(y)
    t+= piece

plt.plot(xp, yp) # plotting all point from array xp, yp
plt.title("Superellipse with parameter "+str(n))
plt.show()
Producción:
Código fuente del programa en Java.
// Java program to implement
// Superellipse
import java.awt.*;
import java.awt.geom.Path2D;
import static java.lang.Math.pow;
import java.util.Hashtable;
import javax.swing.*;
import javax.swing.event.*;

public class SuperEllipse extends JPanel implements ChangeListener {
    private double exp = 2.5;

    public SuperEllipse()
    {
        setPreferredSize(new Dimension(650, 650));
        setBackground(Color.white);
        setFont(new Font("Serif", Font.PLAIN, 18));
    }

    void drawGrid(Graphics2D g)
    {
        g.setStroke(new BasicStroke(2));
        g.setColor(new Color(0xEEEEEE));

        int w = getWidth();
        int h = getHeight();
        int spacing = 25;

        for (int i = 0; i < w / spacing; i++) {
            g.drawLine(0, i * spacing, w, i * spacing);
            g.drawLine(i * spacing, 0, i * spacing, w);
        }
        g.drawLine(0, h - 1, w, h - 1);

        g.setColor(new Color(0xAAAAAA));
        g.drawLine(0, w / 2, w, w / 2);
        g.drawLine(w / 2, 0, w / 2, w);
    }

    void drawLegend(Graphics2D g)
    {
        g.setColor(Color.black);
        g.setFont(getFont());
        g.drawString("n = " + String.valueOf(exp), getWidth() - 150, 45);
        g.drawString("a = b = 200", getWidth() - 150, 75);
    }

    void drawEllipse(Graphics2D g)
    {

        final int a = 200; // a = b
        double[] points = new double[a + 1];

        Path2D p = new Path2D.Double();
        p.moveTo(a, 0);

        // calculate first quadrant
        for (int x = a; x >= 0; x--) {
            points[x] = pow(pow(a, exp) - pow(x, exp), 1 / exp); // solve for y
            p.lineTo(x, -points[x]);
        }

        // mirror to others
        for (int x = 0; x <= a; x++)
            p.lineTo(x, points[x]);

        for (int x = a; x >= 0; x--)
            p.lineTo(-x, points[x]);

        for (int x = 0; x <= a; x++)
            p.lineTo(-x, -points[x]);

        g.translate(getWidth() / 2, getHeight() / 2);
        g.setStroke(new BasicStroke(2));

        g.setColor(new Color(0x25B0C4DE, true));
        g.fill(p);

        g.setColor(new Color(0xB0C4DE)); // LightSteelBlue
        g.draw(p);
    }

    @Override
    public void paintComponent(Graphics gg)
    {
        super.paintComponent(gg);
        Graphics2D g = (Graphics2D)gg;
        g.setRenderingHint(RenderingHints.KEY_ANTIALIASING,
                           RenderingHints.VALUE_ANTIALIAS_ON);
        g.setRenderingHint(RenderingHints.KEY_TEXT_ANTIALIASING,
                           RenderingHints.VALUE_TEXT_ANTIALIAS_ON);

        drawGrid(g);
        drawLegend(g);
        drawEllipse(g);
    }

    @Override
    public void stateChanged(ChangeEvent e)
    {
        JSlider source = (JSlider)e.getSource();
        exp = source.getValue() / 2.0;
        repaint();
    }

    public static void main(String[] args)
    {
        SwingUtilities.invokeLater(() -> {
            JFrame f = new JFrame();
            f.setDefaultCloseOperation(JFrame.EXIT_ON_CLOSE);
            f.setTitle("Super Ellipse");
            f.setResizable(false);
            SuperEllipse panel = new SuperEllipse();
            f.add(panel, BorderLayout.CENTER);

            JSlider exponent = new JSlider(JSlider.HORIZONTAL, 1, 9, 5);
            exponent.addChangeListener(panel);
            exponent.setMajorTickSpacing(1);
            exponent.setPaintLabels(true);
            exponent.setBackground(Color.white);
            exponent.setBorder(BorderFactory.createEmptyBorder(20, 20, 20, 20));

            Hashtable<Integer, JLabel> labelTable = new Hashtable<>();
            for (int i = 1; i < 10; i++)
                labelTable.put(i, new JLabel(String.valueOf(i * 0.5)));
            exponent.setLabelTable(labelTable);

            f.add(exponent, BorderLayout.SOUTH);

            f.pack();
            f.setLocationRelativeTo(null);
            f.setVisible(true);
        });
    }
}
Producción:
Enlaces de referencia:
1. Wikipedia – Superelipse
2. WolframMathWorld – Superelipse
Este artículo es una contribución de Subhajit Saha . Si le gusta GeeksforGeeks y le gustaría contribuir, también puede escribir un artículo usando contribuya.geeksforgeeks.org o envíe su artículo por correo a contribuya@geeksforgeeks.org. Vea su artículo que aparece en la página principal de GeeksforGeeks y ayude a otros Geeks.
Escriba comentarios si encuentra algo incorrecto o si desea compartir más información sobre el tema tratado anteriormente.
Publicación traducida automáticamente
Artículo escrito por Subhajit Saha y traducido por Barcelona Geeks. The original can be accessed here. Licence: CCBY-SA