El reconocimiento facial es una de las tareas más populares y controvertidas de la visión artificial. Uno de los hitos más importantes se logra usando Este enfoque fue desarrollado por primera vez por Sirovich y Kirby en 1987 y utilizado por primera vez por Turk y Alex Pentland en la clasificación de rostros en 1991. Es fácil de implementar y, por lo tanto, se usa en muchas de las primeras aplicaciones de reconocimiento de rostros. Pero tiene algunas advertencias, como que este algoritmo requería imágenes de cara recortadas con la luz y la pose adecuadas para el entrenamiento. En este artículo, discutiremos la implementación de este método en python y sklearn.
Primero debemos importar la biblioteca scikit-learn para usar la función API de PCA que se proporciona en esta biblioteca.
La biblioteca scikit-learn también proporcionó una API para obtener LFW_peoplesconjunto de datos También requerimos matplotlib para trazar caras.
Código: Importación de bibliotecas
Python3
# Import matplotlib library
import matplotlib.pyplot as plt

# Import scikit-learn library
from sklearn.model_selection import train_test_split
from sklearn.model_selection import GridSearchCV
from sklearn.datasets import fetch_lfw_people
from sklearn.metrics import classification_report
from sklearn.metrics import confusion_matrix
from sklearn.decomposition import PCA
from sklearn.svm import SVC

import numpy as np
Ahora importamos el conjunto de datos LFW_people usando la función API fetch_lfw_people de sklearn. LFW_prople es el extracto del preproceso de LFW. Contiene 13233 imágenes de 5749 clases de forma 125 * 94 . Esta función proporciona un parámetro min_faces_per_person . Este parámetro nos permite seleccionar las clases que tienen al menos min_faces_per_person imágenes diferentes. Esta función también tiene un parámetro de cambio de tamaño que cambia el tamaño de cada imagen en la cara extraída. Usamos min_faces_per_person = 70 y resize = 0.4 .
Código:
Python3
# this command will download the LFW_people's dataset to hard disk.
lfw_people = fetch_lfw_people(min_faces_per_person = 70, resize = 0.4)

# introspect the images arrays to find the shapes (for plotting)
n_samples, h, w = lfw_people.images.shape

# Instead of providing 2D data, X has data already in the form  of a vector that
# is required in this approach.
X = lfw_people.data
n_features = X.shape[1]

# the label to predict is the id of the person
y = lfw_people.target
target_names = lfw_people.target_names
n_classes = target_names.shape[0]

# Print Details about dataset
print("Number of Data Samples: % d" % n_samples)
print("Size of a data sample: % d" % n_features)
print("Number of Class Labels: % d" % n_classes)
Producción:

Código: Exploración de datos
Python3
# Function to plot images in 3 * 4
def plot_gallery(images, titles, h, w, n_row = 3, n_col = 4):
    plt.figure(figsize =(1.8 * n_col, 2.4 * n_row))
    plt.subplots_adjust(bottom = 0, left =.01, right =.99, top =.90, hspace =.35)
    for i in range(n_row * n_col):
        plt.subplot(n_row, n_col, i + 1)
        plt.imshow(images[i].reshape((h, w)), cmap = plt.cm.gray)
        plt.title(titles[i], size = 12)
        plt.xticks(())
        plt.yticks(())

# Generate true labels above the images
def true_title(Y, target_names, i):
    true_name = target_names[Y[i]].rsplit(' ', 1)[-1]
    return 'true label:   % s' % (true_name)

true_titles = [true_title(y, target_names, i)
                     for i in range(y.shape[0])]
plot_gallery(X, true_titles, h, w)
Ahora, aplicamos train_test_split para dividir los datos en conjuntos de entrenamiento y prueba. Usamos el 25% de los datos para las pruebas.
Código: dividir el conjunto de datos
Python3
X_train, X_test, y_train, y_test = train_test_split(
    X, y, test_size = 0.25, random_state = 42)
print("size of training Data is % d and Testing Data is % d" %(
        y_train.shape[0], y_test.shape[0]))
Ahora, aplicamos el algoritmo PCA en el conjunto de datos de entrenamiento que calcula EigenFaces. Aquí, tomamos n_components = 150 , lo que significa que extraemos las 150 Eigenfaces principales del algoritmo. También imprimimos el tiempo necesario para aplicar este algoritmo.
Código: Implementación de PCA
Python3
n_components = 150

t0 = time()
pca = PCA(n_components = n_components, svd_solver ='randomized',
          whiten = True).fit(X_train)
print("done in % 0.3fs" % (time() - t0))

eigenfaces = pca.components_.reshape((n_components, h, w))

print("Projecting the input data on the eigenfaces orthonormal basis")
t0 = time()
X_train_pca = pca.transform(X_train)
X_test_pca = pca.transform(X_test)
print("done in % 0.3fs" % (time() - t0))
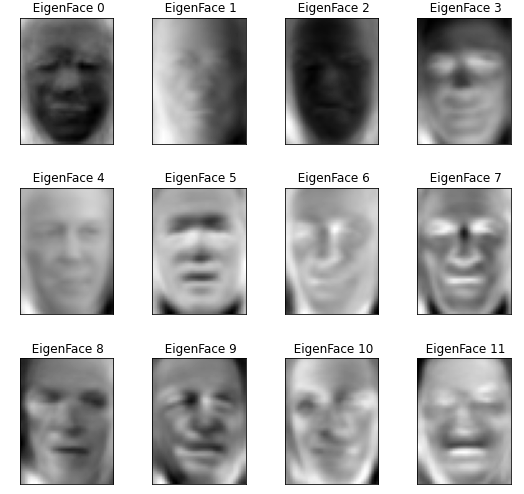
El código anterior genera EigenFace y cada imagen está representada por un vector de tamaño 1 * 150 . Los valores de este vector representan el coeficiente correspondiente a esa cara propia. Estos coeficientes se generan utilizando la función de transformación en la función.
Caras propias generadas por este algoritmo PCA:
Código: Explore el coeficiente generado por el algoritmo anterior.
Python3
print("Sample Data point after applying PCA\n", X_train_pca[0])
print("-----------------------------------------------------")
print("Dimensions of training set = % s and Test Set = % s"%(
        X_train.shape, X_test.shape))
Sample Data point after applying PCA
[-2.0756025  -1.0457923   2.126936    0.03682641 -0.7575693  -0.51736575
  0.8555038   1.0519465   0.45772424  0.01348036 -0.03962574  0.63872665
  0.4816719   2.337867    1.7784412   0.13310494 -2.271292   -4.4569106
  2.0977738  -1.1379385   0.1884598  -0.33499134  1.1254574  -0.32403082
  0.14094219  1.0769527   0.7588098  -0.09976506  3.1199582   0.8837879
 -0.893391    1.1595601   1.430711    1.685587    1.3434631  -1.2590996
 -0.639135   -2.336333   -0.01364169 -1.463893   -0.46878636 -1.0548446
 -1.3329269   1.1364135   2.2223723  -1.801526   -0.3064784  -1.0281631
  4.7735424   3.4598463   1.9261417  -1.3513585  -0.2590924   2.010101
 -1.056406    0.36097565  1.1712595   0.75685936  0.90112156  0.59933555
 -0.46541685  2.0979452   1.3457304   1.9343662   5.068155   -0.70603204
  0.6064072  -0.89698195 -0.21625179 -2.1058862  -1.6839983  -0.19965973
 -1.7508434  -3.0504303   2.051207    0.39461815  0.12691127  1.2121526
 -0.79466134 -1.3895757  -2.0269105  -2.791953    1.4810398   0.1946961
  0.26118103 -0.1208623   1.1642501   0.80152154  1.2733462   0.09606536
 -0.98096275  0.31221238  1.0365396   0.8510516   0.5742255  -0.49945745
 -1.3462409  -1.036648   -0.4910289   1.0547347   1.2205439  -1.3073852
 -1.1884091   1.8626214   0.6881952   1.8356183  -1.6419449   0.57973146
  1.3768481  -1.8154184   2.0562973  -0.14337398  1.3765801  -1.4830858
 -0.0109648   2.245713    1.6913172   0.73172116  1.0212364  -0.09626482
  0.38742945 -1.8325268   0.8476424  -0.33258602 -0.96296996  0.57641584
 -1.1661777  -0.4716097   0.5479076   0.16398667  0.2818301  -0.83848953
 -1.1516216  -1.0798892  -0.58455086 -0.40767965 -0.67279476 -0.9364346
  0.62396616  0.9837545   0.1692572   0.90677387 -0.12059807  0.6222619
 -0.32074842 -1.5255395   1.3164424   0.42598936  1.2535237   0.11011053]
-----------------------------------------------------
Dimensions of training set (966, 1850) and Test Set (322, 1850)
Ahora usamos Support Vector Machine (SVM) como nuestro algoritmo de clasificación. Entrenamos los datos utilizando el coeficiente PCA generado en pasos anteriores.
Código: Aplicación del algoritmo de búsqueda de cuadrícula
Python3
print("Fitting the classifier to the training set")
t0 = time()
param_grid = {'C': [1e3, 5e3, 1e4, 5e4, 1e5],
              'gamma': [0.0001, 0.0005, 0.001, 0.005, 0.01, 0.1], }
clf = GridSearchCV(
    SVC(kernel ='rbf', class_weight ='balanced'), param_grid
)
clf = clf.fit(X_train_pca, y_train)
print("done in % 0.3fs" % (time() - t0))
print("Best estimator found by grid search:")
print(clf.best_estimator_)

print("Predicting people's names on the test set")
t0 = time()
y_pred = clf.predict(X_test_pca)
print("done in % 0.3fs" % (time() - t0))
# print classification results
print(classification_report(y_test, y_pred, target_names = target_names))
# print confusion matrix
print("Confusion Matrix is:")
print(confusion_matrix(y_test, y_pred, labels = range(n_classes)))
Fitting the classifier to the training set
done in 45.872s
Best estimator found by grid search:
SVC(C=1000.0, break_ties=False, cache_size=200, class_weight='balanced',
    coef0=0.0, decision_function_shape='ovr', degree=3, gamma=0.005,
    kernel='rbf', max_iter=-1, probability=False, random_state=None,
    shrinking=True, tol=0.001, verbose=False)
Predicting people's names on the test set
done in 0.076s
                   precision    recall  f1-score   support

     Ariel Sharon       0.75      0.46      0.57        13
     Colin Powell       0.79      0.87      0.83        60
  Donald Rumsfeld       0.89      0.63      0.74        27
    George W Bush       0.84      0.98      0.90       146
Gerhard Schroeder       0.95      0.80      0.87        25
      Hugo Chavez       1.00      0.47      0.64        15
       Tony Blair       0.97      0.81      0.88        36

         accuracy                           0.85       322
        macro avg       0.88      0.72      0.77       322
     weighted avg       0.86      0.85      0.84       322

Confusion Matrix is :
[[  6   3   0   4   0   0   0]
 [  1  52   1   6   0   0   0]
 [  1   2  17   7   0   0   0]
 [  0   3   0 143   0   0   0]
 [  0   1   0   3  20   0   1]
 [  0   3   0   4   1   7   0]
 [  0   2   1   4   0   0  29]]
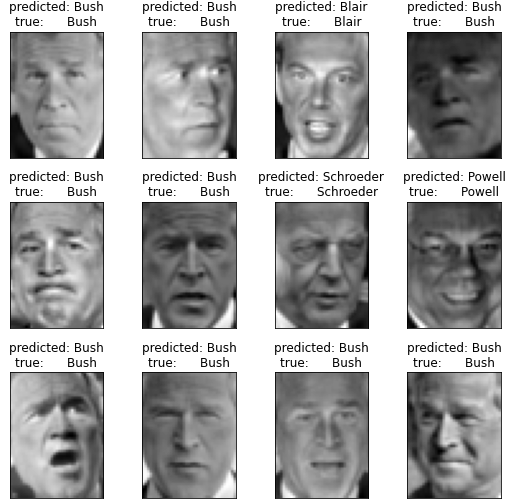
Entonces, nuestra precisión es 0.85 y los resultados de nuestra predicción son:

Referencia:


