Bokeh es una visualización de datos interactiva de Python. Representa sus tramas usando HTML y JavaScript. Se dirige a los navegadores web modernos para presentaciones que proporcionan una construcción elegante y concisa de gráficos novedosos con interactividad de alto rendimiento.
Bokeh se puede utilizar para trazar cuadriláteros en un gráfico. El trazado de cuadriláteros en un gráfico se puede hacer usando el quad()método del plottingmódulo.
plotting.figure.quad()
Sintaxis: quad (parámetros)
Parámetros:
- izquierda : coordenadas x de los bordes izquierdos del cuadrilátero
- right : coordenadas x de los bordes derechos del cuadrilátero
- top : coordenadas y de top los bordes del cuadrilátero
- bottom : coordenadas y de la parte inferior de las aristas del cuadrilátero
Devoluciones: un objeto de clase
GlyphRenderer
Ejemplo 1: En este ejemplo, utilizaremos los valores predeterminados para trazar el gráfico.
# importing the modules
from bokeh.plotting import figure, output_file, show

# file to save the model
output_file("gfg.html")

# instantiating the figure object
graph = figure(title = "Bokeh Quadrilateral Graph",
               match_aspect = True)

# the points to be plotted
top = 3
bottom = 1
left = 0
right = 4

# plotting the graph
graph.quad(left,
           right,
           top,
           bottom)

# displaying the model
show(graph)
Producción :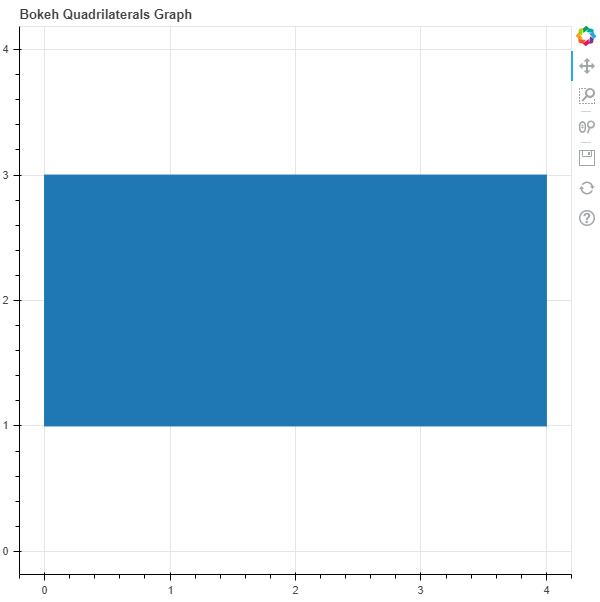
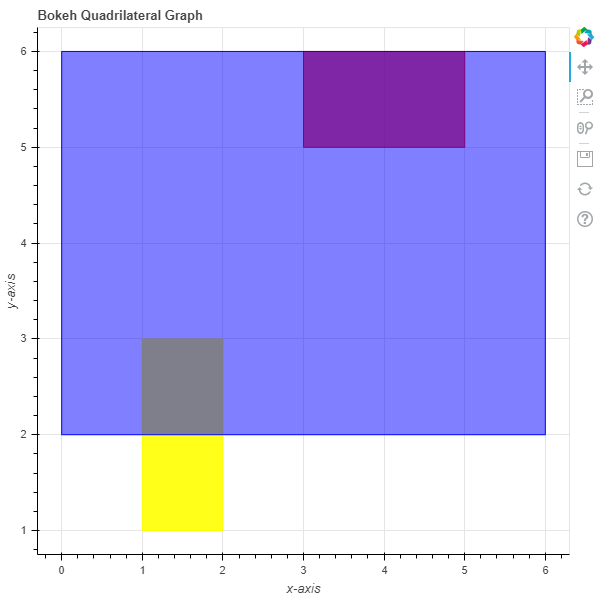
Ejemplo 2: en este ejemplo, trazaremos los cuadriláteros múltiples con varios otros parámetros
# importing the modules
from bokeh.plotting import figure, output_file, show

# file to save the model
output_file("gfg.html")

# instantiating the figure object
graph = figure(title = "Bokeh Quadrilateral Graph")

# name of the x-axis
graph.xaxis.axis_label = "x-axis"

# name of the y-axis
graph.yaxis.axis_label = "y-axis"

# points to be plotted
left = [2, 3, 6]
right = [1, 5, 0]
top = [3, 6, 6]
bottom = [1, 5, 2]

# color value of the patch
color = ["yellow", "red", "blue"]

# fill alpha value of the patch
fill_alpha = [0.9, 0.7, 0.5]

# plotting the graph
graph.quad(left,
           right,
           top,
           bottom,
           color = color,
           fill_alpha = fill_alpha)

# displaying the model
show(graph)
Producción :