Seaborn es una biblioteca de visualización de datos que se basa en matplotlib . Seaborn proporciona una interfaz de alto nivel para dibujar gráficos estadísticos informativos y atractivos. Seaborn Catplot es una nueva adición a seaborn que facilita el trazado e involucra variables categóricas. Se utiliza para mostrar la relación entre variables categóricas como diagrama de franjas, diagrama de caja y más con variables numéricas.
Stripplot, que está representado por strip, es la ilustración predeterminada en c atplot() .
Enfoque paso a paso:
- Importe los módulos requeridos.
Python3
# importing modules
import pandas as pnd
import matplotlib.pyplot as plt
import seaborn as sbn
- Asigne un conjunto de datos y conviértalo en un marco de datos.
Python3
# fetching data from the url
url_data='http://bit.ly/2cLzoxH'

# using pandas for reading the data file
# storing the data in input_data variable
input_data=pnd.read_csv(url_data)
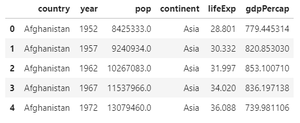
- Mostrar marco de datos.
Python3
# head() function helps to see the first n rows of data
# by default n is 5 in head function
input_data.head(5)
Producción:

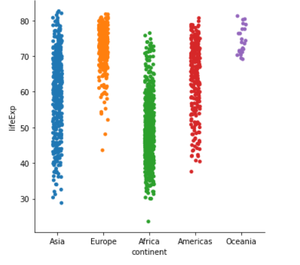
- Finalmente, represente la ilustración.
Python3
# using seaborn module to show the relation between
# categorical variables and numerical variables
sbn.catplot(x='continent', y='lifeExp', data=input_data)
Producción:

A continuación se muestra el programa completo basado en el enfoque anterior:
Python3
# importing modules
import pandas as pnd
import matplotlib.pyplot as plt
import seaborn as sbn


# fetching data from the url
url_data='http://bit.ly/2cLzoxH'

# using pandas for reading the data file
# storing the data in input_data variable
input_data=pnd.read_csv(url_data)


# using seaborn module to show the relation between
# categorical variables and numerical variables
sbn.catplot(x='continent', y='lifeExp', data=input_data)
Producción:

Publicación traducida automáticamente
Artículo escrito por tushardhiman1999 y traducido por Barcelona Geeks. The original can be accessed here. Licence: CCBY-SA