Este artículo analiza los conceptos básicos de la regresión lineal y su implementación en el lenguaje de programación C++. El análisis de regresión es el método de análisis común que utilizan los científicos de datos para la predicción de valores correspondientes a algunos datos de entrada.
El método de análisis de regresión simple es la regresión lineal . La regresión lineal es un método estadístico para modelar relaciones entre una variable dependiente con un conjunto dado de variables independientes. Vamos a implementar lo mismo en C++.
El conjunto de datos de entrada generalmente viene en un archivo .csv (valores separados por comas) que copiaremos de ese archivo y colocaremos en un archivo .txt como archivo de entrada para nuestro programa C++. Para recibir información de un archivo, cree un archivo con nombre input.txt en el mismo directorio que el archivo del programa y coloque los datos dentro de ese archivo de modo que la primera línea tenga el valor de N , es decir, el número de entradas en ese conjunto de datos.
Implementación:
C++
// C++ program to implement
// the above approach
#include <iostream>
#include <stdio.h>
#include <vector>
using namespace std;
class regression {
    // Dynamic array which is going
    // to contain all (i-th x)
    vector<float> x;

    // Dynamic array which is going
    // to contain all (i-th y)
    vector<float> y;

    // Store the coefficient/slope in
    // the best fitting line
    float coeff;

    // Store the constant term in
    // the best fitting line
    float constTerm;

    // Contains sum of product of
    // all (i-th x) and (i-th y)
    float sum_xy;

    // Contains sum of all (i-th x)
    float sum_x;

    // Contains sum of all (i-th y)
    float sum_y;

    // Contains sum of square of
    // all (i-th x)
    float sum_x_square;

    // Contains sum of square of
    // all (i-th y)
    float sum_y_square;

public:
    // Constructor to provide the default
    // values to all the terms in the
    // object of class regression
    regression()
    {
        coeff = 0;
        constTerm = 0;
        sum_y = 0;
        sum_y_square = 0;
        sum_x_square = 0;
        sum_x = 0;
        sum_xy = 0;
    }

    // Function that calculate the coefficient/
    // slope of the best fitting line
    void calculateCoefficient()
    {
        float N = x.size();
        float numerator
            = (N * sum_xy - sum_x * sum_y);
        float denominator
            = (N * sum_x_square - sum_x * sum_x);
        coeff = numerator / denominator;
    }

    // Member function that will calculate
    // the constant term of the best
    // fitting line
    void calculateConstantTerm()
    {
        float N = x.size();
        float numerator
            = (sum_y * sum_x_square - sum_x * sum_xy);
        float denominator
            = (N * sum_x_square - sum_x * sum_x);
        constTerm = numerator / denominator;
    }

    // Function that return the number
    // of entries (xi, yi) in the data set
    int sizeOfData()
    {
        return x.size();
    }

    // Function that return the coefficient/
    // slope of the best fitting line
    float coefficient()
    {
        if (coeff == 0)
            calculateCoefficient();
        return coeff;
    }

    // Function that return the constant
    // term of the best fitting line
    float constant()
    {
        if (constTerm == 0)
            calculateConstantTerm();
        return constTerm;
    }

    // Function that print the best
    // fitting line
    void PrintBestFittingLine()
    {
        if (coeff == 0 && constTerm == 0) {
            calculateCoefficient();
            calculateConstantTerm();
        }
        cout << "The best fitting line is y = "
             << coeff << "x + " << constTerm << endl;
    }

    // Function to take input from the dataset
    void takeInput(int n)
    {
        for (int i = 0; i < n; i++) {
            // In a csv file all the values of
            // xi and yi are separated by commas
            char comma;
            float xi;
            float yi;
            cin >> xi >> comma >> yi;
            sum_xy += xi * yi;
            sum_x += xi;
            sum_y += yi;
            sum_x_square += xi * xi;
            sum_y_square += yi * yi;
            x.push_back(xi);
            y.push_back(yi);
        }
    }

    // Function to show the data set
    showData()
    {
        for (int i = 0; i < 62; i++) {
            printf("_");
        }
        printf("\n\n");
        printf("|%15s%5s %15s%5s%20s\n",
               "X", "", "Y", "", "|");

        for (int i = 0; i < x.size(); i++) {
            printf("|%20f %20f%20s\n",
                   x[i], y[i], "|");
        }

        for (int i = 0; i < 62; i++) {
            printf("_");
        }
        printf("\n");
    }

    // Function to predict the value
    // corresponding to some input
    float predict(float x)
    {
        return coeff * x + constTerm;
    }

    // Function that returns overall
    // sum of square of errors
    float errorSquare()
    {
        float ans = 0;
        for (int i = 0;
             i < x.size(); i++) {
            ans += ((predict(x[i]) - y[i])
                    * (predict(x[i]) - y[i]));
        }
        return ans;
    }

    // Functions that return the error
    // i.e the difference between the
    // actual value and value predicted
    // by our model
    float errorIn(float num)
    {
        for (int i = 0;
             i < x.size(); i++) {
            if (num == x[i]) {
                return (y[i] - predict(x[i]));
            }
        }
        return 0;
    }
};

// Driver code
int main()
{
    freopen("input.txt", "r",
            stdin);
    regression reg;

    // Number of pairs of (xi, yi)
    // in the dataset
    int n;
    cin >> n;

    // Calling function takeInput to
    // take input of n pairs
    reg.takeInput(n);

    // Printing the best fitting line
    reg.PrintBestFittingLine();
    cout << "Predicted value at 2060 = "
         << reg.predict(2060) << endl;
    cout << "The errorSquared  = "
         << reg.errorSquare() << endl;
    cout << "Error in 2050 = "
         << reg.errorIn(2050) << endl;
}
El contenido del archivo input.txt es:
84
1714, 2.4
1664, 2.52
1760, 2.54
1685, 2.74
1693, 2.83
1670, 2.91
1764, 3
1764, 3
1792, 3.01
1850, 3.01
1735, 3.02
1775, 3.07
1735, 3.08
1712, 3.08
1773, 3.12
1872, 3.17
1755, 3.17
1674, 3.17
1842, 3.17
1786, 3.19
1761, 3.19
1722, 3.19
1663, 3.2
1687, 3.21
1974, 3.24
1826, 3.28
1787, 3.28
1821, 3.28
2020, 3.28
1794, 3.28
1769, 3.28
1934, 3.28
1775, 3.29
1855, 3.29
1880, 3.29
1849, 3.31
1808, 3.32
1954, 3.34
1777, 3.37
1831, 3.37
1865, 3.37
1850, 3.38
1966, 3.38
1702, 3.39
1990, 3.39
1925, 3.4
1824, 3.4
1956, 3.4
1857, 3.41
1979, 3.41
1802, 3.41
1855, 3.42
1907, 3.42
1634, 3.42
1879, 3.44
1887, 3.47
1730, 3.47
1953, 3.47
1781, 3.47
1891, 3.48
1964, 3.49
1808, 3.49
1893, 3.5
2041, 3.51
1893, 3.51
1832, 3.52
1850, 3.52
1934, 3.54
1861, 3.58
1931, 3.58
1933, 3.59
1778, 3.59
1975, 3.6
1934, 3.6
2021, 3.61
2015, 3.62
1997, 3.64
2020, 3.65
1843, 3.71
1936, 3.71
1810, 3.71
1987, 3.73
1962, 3.76
2050, 3.81
Producción:
The best fitting line is y = 0.00165565x + 0.27511
Predicted value at 2060 = 3.68575
The errorSquared  = 3.63727
Error in 2050 = 0.140807
Explicación:
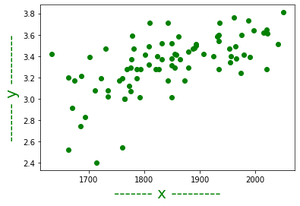
1. Si se trazan todos los elementos de datos en un gráfico, obtendremos varios puntos en el gráfico, ahora la línea que mejor se ajusta es la línea que está más cerca de cada punto en el gráfico.

Representación gráfica de datos
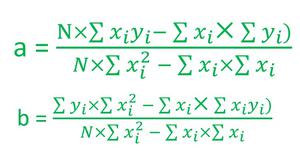
2. La siguiente tarea es encontrar la mejor línea de ajuste. Como toda recta se puede representar de la forma y = ax + b, donde a es el coeficiente o pendiente de la recta y b es el término constante.
3. Entonces, para encontrar la mejor línea de ajuste, calcule los valores de a y b. Hay una fórmula sencilla para calcular los valores de a y b que se parece a las siguientes:

Fórmulas para a y b
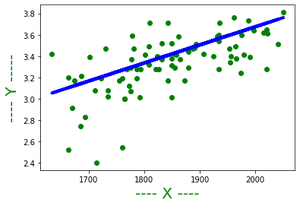
4. Después de calcular el valor de a y b, se puede representar la línea en el gráfico como:

La línea que mejor se adapta
Publicación traducida automáticamente
Artículo escrito por abhishek005 y traducido por Barcelona Geeks. The original can be accessed here. Licence: CCBY-SA